Original data · 10 to 16 November 2026
Find Your Type Statistics: 4,502,629 Taps on AI Faces, 10 to 16 November 2026
In one week, visitors to Find Your Type tapped the AI-generated faces they liked 4,502,629 times, in 48,356 runs of the test. A face dealt at random was tapped about one time in ten (10.3% for women's faces, 10.1% for men's). When one run tapped a face, a second run shown the same face tapped it only 16.4% of the time. Every face is AI-generated, a run is one pass through the test and not a person, and the test does not record who is tapping, so the figures describe taps on this deck in this week and not what any population finds attractive.
The Week in Numbers
| Count | Total |
|---|---|
| Runs started | 48,356 |
| Runs that reached a result (6 or more grids) | 43,673 (90.3%) |
| Grids completed | 1,084,545 |
| Faces shown | 17,518,035 |
| Taps | 4,502,629 |
| Grids passed with no tap | 408,784 (37.7%) |
| Runs on men's faces | 25,540 (52.8%) |
| Runs on women's faces | 16,993 (35.1%) |
| Runs on both decks | 5,823 (12.0%) |
| Countries with at least one run | 155 |
A run is one pass through the test by one browser on one day. A visitor chooses women's faces, men's faces or both, is shown 12 faces at a time and taps the ones they like; each tap brings a new face into the grid. The busiest day was 13 November, with 16,016 runs.
Every tap rate below is measured on showings only. A showing is one of the first 12 faces of a grid dealt at random: the first grid of every run, then about one grid in five. The other grids hold faces the test expects that visitor to like, and the face that replaces a tapped one is chosen the same way, so their tap rate reflects the test's guess as much as anyone's taste. There were 233,869 randomly dealt grids: 1,102,902 showings of women's faces (114,023 tapped) and 1,700,370 of men's (171,546 tapped). Download the summary counts (CSV).
How Picky People Are
A face dealt at random was tapped about one time in ten: 10.3% of showings for women's faces and 10.1% for men's. In more than half of randomly dealt grids nobody tapped any of the 12 faces (52.5% of women's grids, 55.0% of men's).
Women's faces: how many of 12 random faces were tapped (75,968 grids)
None
52.5%
1
19.3%
2
10.8%
3
6.5%
4
4.1%
5
2.7%
6 to 12
4.1%
Men's faces: how many of 12 random faces were tapped (127,300 grids)
None
55.0%
1
17.2%
2
9.6%
3
6.3%
4
4.3%
5
2.9%
6 to 12
4.6%
Over a whole run the spread is wide. Among the 43,673 runs that reached a result, the median run tapped 3.47 faces a grid. A quarter of runs tapped 1.46 or fewer and a quarter tapped 7.87 or more; one run in ten tapped more than 15.75. A grid has no upper limit of 12, because every tap brings in another face, and most grids after the first are chosen to suit the visitor, so these figures are higher than the random-grid rate above. 37.7% of all grids were passed with no tap.
| Deck | Runs | Lowest tenth | Lower quarter | Median | Upper quarter | Highest tenth |
|---|---|---|---|---|---|---|
| All decks | 43,673 | 0.63 or fewer | 1.46 or fewer | 3.47 | 7.87 or more | 15.75 or more |
| Women's faces | 15,125 | 0.67 or fewer | 1.5 or fewer | 3.45 | 7.6 or more | 14.86 or more |
| Men's faces | 23,379 | 0.58 or fewer | 1.41 or fewer | 3.43 | 8 or more | 16.21 or more |
| Both decks | 5,169 | 0.69 or fewer | 1.63 or fewer | 3.7 | 8.29 or more | 16.5 or more |
How Much Two People's Picks Agree
Take two runs that were both dealt the same face at random. When the first run tapped it, the second tapped it 16.4% of the time for women's faces and 15.7% for men's. When the first run passed over it, the second tapped it 9.9% and 10.3% of the time. So one person's tap raises the chance of another's by a half to two thirds, and most of the time the second person still does not tap.
| Measure | Women's faces | Men's faces |
|---|---|---|
| The second run tapped it (all pairs of runs) | 10.6% | 10.9% |
| The second run tapped it, when the first did | 16.4% | 15.7% |
| The second run tapped it, when the first did not | 9.9% | 10.3% |
| Faces both runs tapped, of the faces either tapped | 9.0% | 8.5% |
| That overlap if every face were equally likely to be tapped | 5.6% | 5.8% |
The overlap row is the closest figure here to "how much do two people share a type": of the faces that at least one of two runs tapped, both tapped 9.0% (women's faces) and 8.5% (men's). With no agreement at all it would be 5.6% and 5.8%.
Taps are also concentrated on a small part of the deck. The most-tapped hundredth of women's faces took 4.2% of the taps, 4.2 times an average face's share; for men's faces it was 3.7%, 3.7 times.
| Faces | Women's faces | Men's faces |
|---|---|---|
| Most-tapped 1% of faces | 4.2% of taps | 3.7% of taps |
| Most-tapped 10% of faces | 29.4% of taps | 27.6% of taps |
| Least-tapped half of faces | 17.1% of taps | 17.2% of taps |
| Faces counted (60 or more showings in each half of the runs) | 3,324 | 4,747 |
To keep luck out of the ranking, faces were ranked on one half of the runs and their taps counted in the other half, both ways, and the two results averaged.
What Gets Tapped: Tap Rate by Look
Every face in the deck carries labels for how it looks (hair, eyes, apparent age, a heritage label, facial hair and so on), given by a vision model. Each cell is how often faces with that label were tapped when dealt at random and, in brackets, that rate as a multiple of the deck's own (10.3% for women's faces, 10.1% for men's). The differences are large, and they are printed as measured.
Apparent age
| Age the face looks | Women's faces | Men's faces |
|---|---|---|
| Looks under 25 | 18.4% (1.78x) | 14.3% (1.42x) |
| Looks 25 to 29 | 12.2% (1.18x) | 12.0% (1.19x) |
| Looks 30 to 39 | 7.4% (0.71x) | 8.0% (0.79x) |
| Looks 40 to 49 | 4.0% (0.39x) | 4.9% (0.48x) |
| Looks 50 and over | 2.0% (0.20x) | 2.1% (0.20x) |
Tap rate fell with every step in apparent age on both decks: from 18.4% for women's faces that look under 25 to 2.0% for those that look 50 or over, and from 14.3% to 2.1% for men's faces.
Hair colour and eye colour
| Hair colour | Women's faces | Men's faces |
|---|---|---|
| Blonde hair | 13.4% (1.30x) | 11.6% (1.15x) |
| Red hair | 13.0% (1.26x) | 10.9% (1.08x) |
| Brown hair | 12.5% (1.21x) | 13.1% (1.30x) |
| Light brown hair | 12.4% (1.20x) | 12.0% (1.19x) |
| Dark brown hair | 11.4% (1.10x) | 12.3% (1.21x) |
| Black hair | 8.8% (0.85x) | 7.5% (0.74x) |
| Dyed hair | 7.8% (0.75x) | 5.8% (0.58x) |
| Grey hair | 3.8% (0.36x) | 4.9% (0.48x) |
| Eye colour | Women's faces | Men's faces |
|---|---|---|
| Green eyes | 12.5% (1.21x) | 11.6% (1.15x) |
| Brown eyes | 12.5% (1.21x) | 13.3% (1.31x) |
| Blue eyes | 12.1% (1.17x) | 11.2% (1.11x) |
| Hazel eyes | 11.0% (1.07x) | 11.5% (1.14x) |
| Dark brown eyes | 9.2% (0.89x) | 8.6% (0.85x) |
Heritage label
| Heritage label | Women's faces | Men's faces |
|---|---|---|
| White | 12.1% (1.17x) | 12.3% (1.22x) |
| Mixed | 11.3% (1.10x) | 12.1% (1.20x) |
| East Asian | 12.0% (1.16x) | 9.5% (0.95x) |
| Latino | 9.6% (0.93x) | 11.3% (1.12x) |
| Middle Eastern or North African | 10.0% (0.97x) | 10.2% (1.01x) |
| Southeast Asian | 10.7% (1.03x) | 8.0% (0.79x) |
| South Asian | 7.9% (0.77x) | 7.1% (0.71x) |
| Black | 5.3% (0.52x) | 5.2% (0.51x) |
The heritage label is the vision model's reading of an AI-generated face, not anyone's ancestry. On both decks faces labelled Black were tapped about half as often as the deck's rate, and faces labelled South Asian less often than the rest. Who is tapping matters here: the country table shows these rates differ by country, and the next section shows they are among the looks that divide people most.
Facial hair, hair length and texture
| Facial hair | Men's faces |
|---|---|
| Short beard | 11.6% (1.15x) |
| Moustache | 10.2% (1.01x) |
| No facial hair | 10.1% (1.00x) |
| Stubble | 10.0% (0.99x) |
| Full beard | 5.9% (0.58x) |
| Hair | Women's faces | Men's faces |
|---|---|---|
| Shaved head | too few faces | 2.5% (0.25x) |
| Very short hair | 4.1% (0.40x) | 8.1% (0.81x) |
| Short hair | 8.6% (0.83x) | 10.2% (1.01x) |
| Medium hair | 9.9% (0.95x) | 12.2% (1.21x) |
| Long hair | 11.6% (1.12x) | 5.2% (0.51x) |
| Straight hair | 10.5% (1.02x) | 7.1% (0.70x) |
| Wavy hair | 12.0% (1.16x) | 12.1% (1.20x) |
| Curly hair | 8.8% (0.86x) | 11.3% (1.12x) |
| Coily hair | 5.1% (0.49x) | 6.4% (0.64x) |
Glasses, freckles, dimples, smiles and makeup
| Look | Women's faces | Men's faces |
|---|---|---|
| Glasses | 8.9% (0.86x) | 9.7% (0.96x) |
| No glasses | 10.6% (1.03x) | 10.2% (1.01x) |
| Freckles | 11.9% (1.15x) | 11.8% (1.17x) |
| No freckles | 10.0% (0.96x) | 9.8% (0.97x) |
| Dimples | 10.7% (1.03x) | 11.4% (1.13x) |
| No dimples | 10.3% (1.00x) | 10.0% (0.99x) |
| Neutral | 10.3% (0.99x) | 9.6% (0.96x) |
| Soft smile | 10.4% (1.00x) | 10.5% (1.04x) |
| Smile | 10.4% (1.01x) | 10.2% (1.02x) |
| Makeup | Women's faces |
|---|---|
| Light makeup | 12.0% (1.16x) |
| Defined makeup | 11.4% (1.10x) |
| No makeup | 7.2% (0.69x) |
Type tags
Each face also carries a few tags for the kind of person it reads as. The five tags tapped most against the deck's rate, and the five tapped least:
| Rank | Women's faces | Men's faces |
|---|---|---|
| 1 | "Sorority girl", 1.76x | "Golden retriever energy", 1.49x |
| 2 | "It girl", 1.48x | "Model", 1.47x |
| 3 | "Soft girl", 1.48x | "Heartthrob", 1.44x |
| 4 | "Tanned", 1.35x | "Strong jaw", 1.37x |
| 5 | "Glamorous", 1.31x | "Brunette", 1.30x |
| Rank | Women's faces | Men's faces |
|---|---|---|
| 1 from last | "Mom energy", 0.18x | "Dad energy", 0.21x |
| 2 from last | "Serious", 0.31x | "Serious", 0.24x |
| 3 from last | "Pale", 0.34x | "Mature", 0.32x |
| 4 from last | "Mature", 0.35x | "Distinguished", 0.36x |
| 5 from last | "Silver fox", 0.37x | "Lumberjack", 0.43x |
Labels overlap. A face with black hair is more often one with dark brown eyes and one of the heritage labels with a lower tap rate, so a row is the tap rate of faces carrying that label, not the effect of that feature alone. Rows need 30 or more faces and 5,000 or more showings. All labels and tags with their counts: download the look table (CSV).
Looks That Divide People, and Looks They Agree On
A low tap rate can mean two things: few people like a look, or most people pass it while some tap it again and again. To tell them apart we asked, for each look: when a run tapped one face with the look, how much more likely was it to tap a second face with it than a run that had tapped a face without it? Runs are compared only with runs that tap about as many faces.
Any set of rarely tapped faces scores above 1 on that measure, because the runs that tap them are the ones that stray from the crowd. So each look's figure is divided by the figure for an arbitrary set of faces tapped as rarely. The result is the personal index: 1.00 means the look is no more a matter of personal taste than its tap rate alone implies, and higher means that whether a face with it gets tapped depends more on who is looking.
Women's faces: the looks that divide most
| Look | Tap rate against deck | Second tap against other runs | Personal index |
|---|---|---|---|
| Skin tone 6 of 7 | 0.49x | 2.16x | 1.70 |
| Black (heritage label) | 0.52x | 1.94x | 1.55 |
| Coily hair | 0.49x | 1.94x | 1.53 |
| Skin tone 5 of 7 | 0.59x | 1.61x | 1.36 |
| East Asian (heritage label) | 1.16x | 1.25x | 1.21 |
| "Goth" tag | 0.94x | 1.27x | 1.20 |
| South Asian (heritage label) | 0.77x | 1.27x | 1.17 |
| Blonde hair | 1.30x | 1.18x | 1.16 |
Men's faces: the looks that divide most
| Look | Tap rate against deck | Second tap against other runs | Personal index |
|---|---|---|---|
| Skin tone 6 of 7 | 0.55x | 1.74x | 1.46 |
| Long hair | 0.51x | 1.74x | 1.41 |
| Black (heritage label) | 0.51x | 1.70x | 1.37 |
| East Asian (heritage label) | 0.95x | 1.39x | 1.30 |
| "Alt" tag | 0.58x | 1.51x | 1.29 |
| Subtle cheekbones | 0.19x | 3.03x | 1.28 |
| Shaved head | 0.25x | 2.32x | 1.27 |
| Full beard | 0.58x | 1.48x | 1.26 |
On both decks the looks that divide most are skin tone, the heritage labels and hair: runs that tap one face labelled Black or East Asian are much more likely to tap another, while most runs tap few. Long hair, full beards and the alt look do the same on men's faces, and the goth look and blonde hair on women's.
Looks runs agree on
These looks have a tap rate far from the deck's and a personal index of 1.03 or less: that a run tapped one such face says no more about its next tap than it would for any faces tapped as often. Runs differ in how many faces they tap, and not in how they rank these.
| Women's faces: look | Tap rate against deck | Personal index |
|---|---|---|
| "Sorority girl" tag | 1.76x | 1.03 |
| "It girl" tag | 1.48x | 1.01 |
| "Soft girl" tag | 1.48x | 1.01 |
| "Glamorous" tag | 1.31x | 1.00 |
| Wide nose | 0.27x | 0.97 |
| Round face | 0.29x | 0.98 |
| Looks 40 to 49 | 0.39x | 1.02 |
| Subtle cheekbones | 0.42x | 0.92 |
| Men's faces: look | Tap rate against deck | Personal index |
|---|---|---|
| "Heartthrob" tag | 1.44x | 1.02 |
| "Strong jaw" tag | 1.37x | 1.02 |
| Bangs | 1.33x | 1.00 |
| Brown eyes | 1.31x | 1.02 |
| "Dad energy" tag | 0.21x | 0.95 |
| Soft jaw | 0.22x | 0.95 |
| "Nerdy" tag | 0.60x | 1.00 |
| Prominent nose | 0.66x | 0.98 |
The index needs 3,000 or more pairs of showings that start from a tapped face with the look; rarer looks are left out. Where a tag repeats a labelled feature (the "blonde" tag and blonde hair) only the feature is listed.
Popular Against Adored
A face can be tapped often because many people tap almost everything, or because the people who tap almost nothing make an exception for it. To separate the two, runs that reached a result were split by how many faces they tapped in the grids the test chose for them. The picky quarter (10,996 runs) tapped 1.6 faces a grid or fewer; the easy-going quarter (10,954 runs) tapped 8.5 or more.
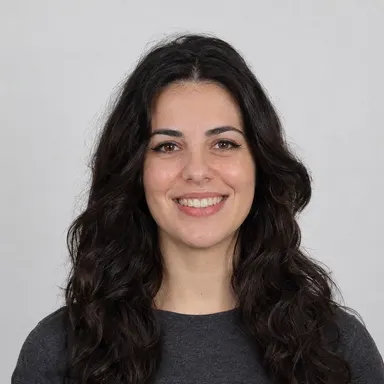
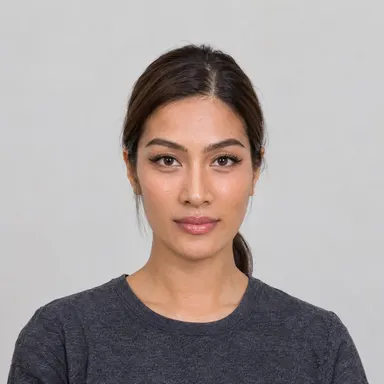
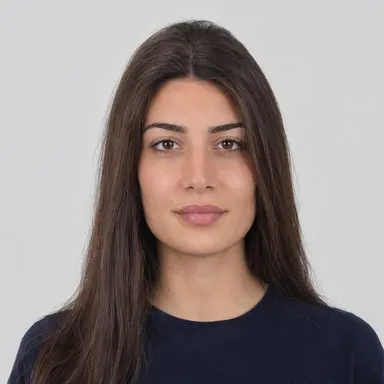
On randomly dealt faces the picky quarter tapped 2.1% of women's faces and 1.9% of men's; the easy-going quarter tapped 30.8% and 31.4%. The two quarters mostly rank faces the same way (rank correlation 0.76 for women's faces and 0.76 for men's), but the picky quarter's taps are far more concentrated: the hundredth of faces they tapped most were tapped by 12.7% or more of them (women's faces) and 9.9% or more (men's), about six and five times their average.
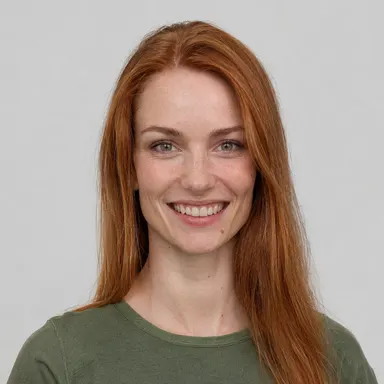
Women's faces: adored (the picky quarter's most tapped)
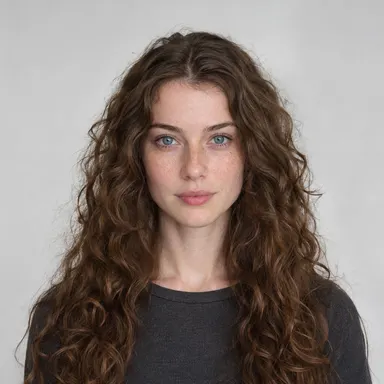
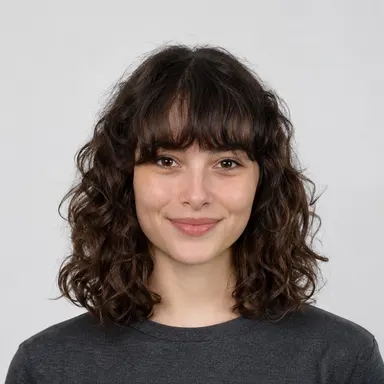
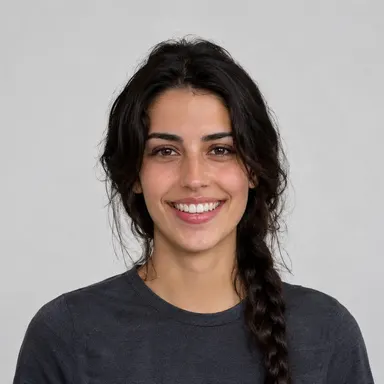
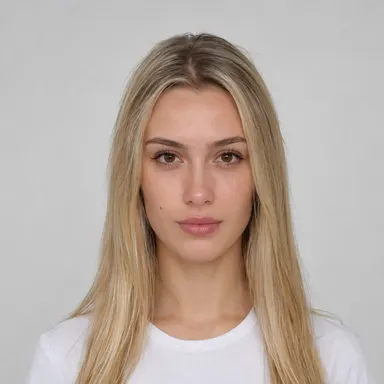
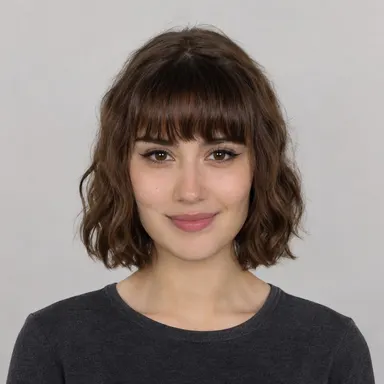
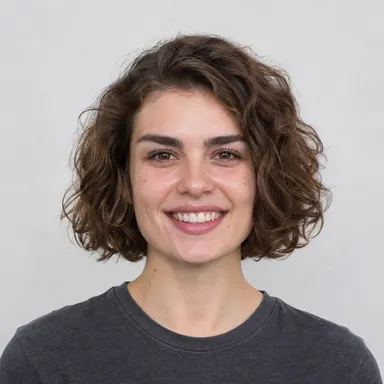
Women's faces: popular, not adored (about half the easy-going quarter, almost none of the picky)
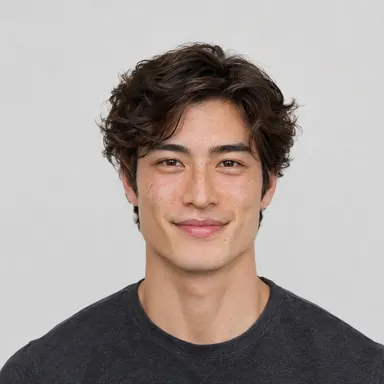
Men's faces: adored (the picky quarter's most tapped)

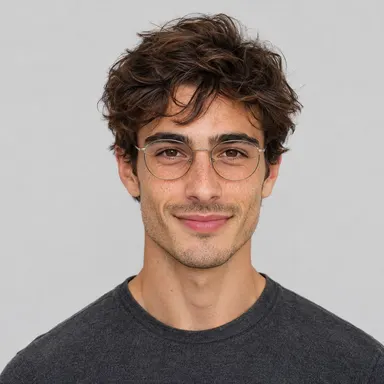
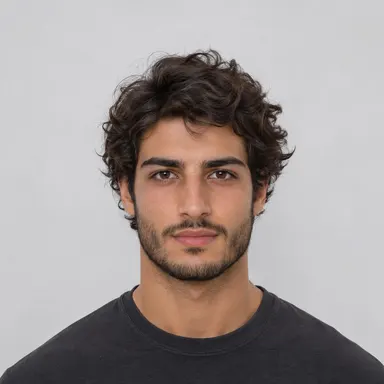
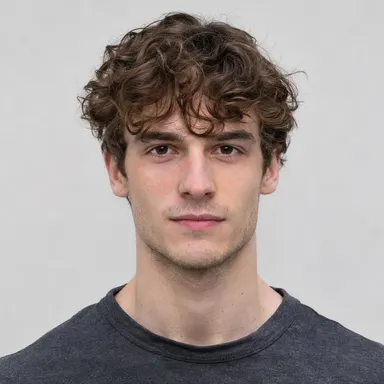
Men's faces: popular, not adored (about half the easy-going quarter, almost none of the picky)
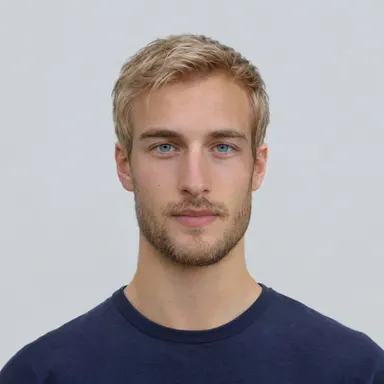
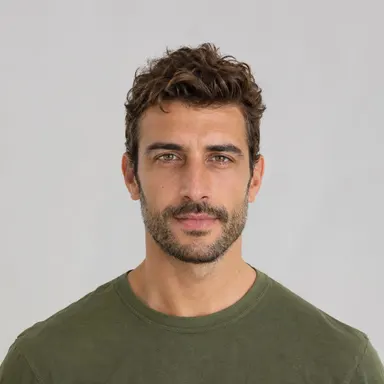
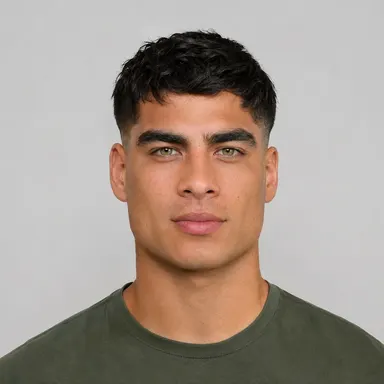
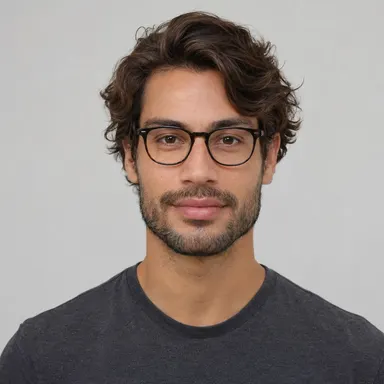
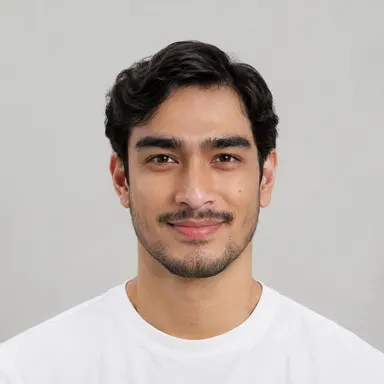
All faces are AI-generated; no real person is shown. Under each face: the share of the picky quarter and of the easy-going quarter that tapped it when it was dealt at random. Faces needed 40 or more showings to each quarter (2,109 women's and 2,313 men's faces qualified), and each rate is pulled towards its quarter's average by 20 showings, so a face shown few times cannot lead a row by luck alone. With 40 to 250 showings a face these are examples from one week, not a ranking.
By Country
17 countries had 500 or more runs in the week. The country is where the browser was, taken from the request; nothing else about the visitor is recorded. Tap rates differ a great deal: on men's faces the highest were in Brazil (14.9%) and Mexico (14.0%) and the lowest in Finland (5.0%) and Ukraine (5.0%).
| Country | Runs | Women's faces tapped | Men's faces tapped |
|---|---|---|---|
| United States | 19,646 | 11.5% | 11.7% |
| United Kingdom | 2,990 | 11.4% | 11.8% |
| Canada | 2,207 | 10.3% | 10.9% |
| Germany | 1,847 | 8.2% | 6.3% |
| Ukraine | 1,543 | 9.5% | 5.0% |
| Netherlands | 1,444 | 8.9% | 6.1% |
| Brazil | 1,321 | 12.6% | 14.9% |
| France | 1,288 | 10.3% | 10.1% |
| Australia | 1,115 | 9.4% | 9.6% |
| Poland | 833 | 8.9% | 6.9% |
| Spain | 821 | 9.4% | 10.0% |
| Finland | 659 | 10.6% | 5.0% |
| Philippines | 645 | 8.9% | 11.1% |
| Turkey | 623 | 7.6% | 7.6% |
| Italy | 579 | 10.5% | 9.9% |
| Mexico | 552 | 13.6% | 14.0% |
| India | 504 | 11.2% | 10.6% |
The look each country tapped more than elsewhere
| Country | On women's faces | On men's faces |
|---|---|---|
| United States | Black (heritage label), 1.27x | "Preppy" tag, 1.30x |
| United Kingdom | nothing stood out | "Athletic" tag, 1.15x |
| Germany | "Cool girl" tag, 1.19x | Long hair, 1.34x |
| Ukraine | "Goth" tag, 1.47x | Long hair, 1.90x |
| Netherlands | nothing stood out | Long hair, 1.44x |
| Brazil | nothing stood out | "Dad energy" tag, 1.85x |
| France | nothing stood out | Full beard, 1.30x |
| Poland | "Alt" tag, 1.31x | Long hair, 1.78x |
| Spain | nothing stood out | Short beard, 1.18x |
| Finland | Blonde hair, 1.26x | nothing stood out |
| Philippines | nothing stood out | Southeast Asian (heritage label), 1.86x |
| Turkey | Brown hair, 1.48x | Blue eyes, 1.41x |
This table names the look a country tapped more than the rest of the world did, after allowing for how many faces the country taps at all: the look's tap rate over the country's own rate, divided by the same figure for every run outside the country. Only differences at least four standard errors from no difference are named, on 1,500 or more showings in that country, and the largest is shown; 5 countries had no difference that large.
A country's figures describe whoever in that country played that week and which deck they chose, not the country. The week included one large spike in visitors on 13 November. Download the country table (CSV).
Method
- Collection dates
- 10 to 16 November 2026, 7 whole days in UTC. The figures were computed on 17 November 2026.
- Source
- Find Your Type records, for every completed grid, which faces were shown and which were tapped. Each day's grids are copied once to an archive in which the browser session is replaced by a random id that is kept nowhere and the time is cut down to the day. Every figure here was computed from that archive and from the last two days read in the same form. The test takes no photo and asks no questions about the visitor.
- Unit
- A run: one pass through the test by one browser on one UTC day. A visitor who plays twice, or on two days, is two runs, and nothing links them. A run that crosses midnight is counted once in "runs started", with its grids counted on the day they were completed.
- Showings and tap rate
- A tap rate is taps over showings. A showing is one of the first 12 faces of a randomly dealt grid, counted once per run and face. Faces picked by the test's model are left out of every rate: the grids it deals, and the face it brings in when one is tapped. Counting those would more than double the tap rate, because they are chosen to be liked.
- The faces and their labels
- The deck held 9,986 AI-generated faces of adults when the figures were computed. No real person is in it. Faces were added during the week, so not every face was available on every day, and looks that are rare in the deck are dealt a little less often, which lowers their count of showings and not their tap rate. 14,579 of the 17,518,035 faces shown (0.1%) were faces since removed from the deck; they are in the totals and in no rate. Hair, eyes, apparent age, heritage label, skin tone and type tags were assigned to each face by vision models and not checked face by face.
- Who is in the sample
- People who chose to play a free online test that week, arriving from searches for the test and from social media posts about it. It is a self-selected sample, not a survey. The visitor's sex, age and orientation are not asked or stored, so a deck's figures mix everyone who chose that deck, and "women's faces" says which faces were shown, not who tapped them.
- Exclusions
- Our own test sessions, sessions whose owner used "Delete my data", and sessions marked as under 18 are removed before the archive is written. Rows a browser could not have produced are dropped. Nothing else is filtered.
- The personal index
- For each look, two rates are taken over pairs of showings inside one run: how often a second face with the look was tapped when the run had tapped a first one, and how often a face with the look was tapped when the run had tapped a face without it. Both are averaged over 20 bands of runs that tap about as many faces a grid, with the same weights, and the first is divided by the second. The yardstick is the same ratio for ten sets of faces grouped only by tap rate (tenths of each deck); a look's index is its ratio over the yardstick at its own tap rate.
- What is left out
- Nothing per person: the archive cannot say what one visitor did across days. No city, and no country under 500 runs. No ranking of single faces beyond the examples above. And no estimate for any real face: these are rates for labelled AI faces in one deck, and we do not apply them to a visitor's photo.
Cite or Reuse This Data
The Face Report (2026). Find Your Type statistics: 4,502,629 taps in 48,356 runs, 10 to 16 November 2026. https://thefacereport.com/guides/find-your-type-statistics
The tables and the three CSV files are free to reuse under CC BY 4.0: quote or republish them with a credit to The Face Report and a link to this page. Please describe the figures as taps on AI-generated faces in runs of Find Your Type, 10 to 16 November 2026, not as a share of people. When the data is refreshed, this address will carry the new period and the file names will change with it.
Frequently Asked Questions
What do people find attractive in a face, according to this data?
In 2,803,272 randomly dealt showings of AI-generated faces on The Face Report's Find Your Type test, 10 to 16 November 2026, a face was tapped about one time in ten (10.3% for women's faces, 10.1% for men's). Apparent age moved the rate most: women's faces that look under 25 were tapped 18.4% of the time and those that look 50 or over 2.0%; for men's faces it was 14.3% and 2.1%. These are tap rates on one deck of AI faces by people who chose to play, not a survey, and the test does not record who is tapping.
What is the most attractive eye colour?
There is no single answer, but in this data the lighter and mid-brown eye colours were tapped at similar rates and dark brown eyes less. Women's faces: green 12.5%, brown 12.5%, blue 12.1%, hazel 11.0%, dark brown 9.2%. Men's faces: brown 13.3%, green 11.6%, hazel 11.5%, blue 11.2%, dark brown 8.6%. Eye colour goes with hair colour and heritage label in the deck, so this is the rate for faces with that eye colour, not the effect of eye colour alone.
What is the most attractive hair colour? Do people prefer blondes or brunettes?
On women's faces blonde hair was tapped most (13.4%), then red (13.0%), brown (12.5%) and dark brown (11.4%); black hair was tapped 8.8%. On men's faces brown (13.1%) and dark brown (12.3%) led blonde (11.6%), with black at 7.5% and grey at 4.9%. Blonde hair is also one of the looks that divides people most: a run that tapped one blonde face was more likely than other runs to tap another.
Do people like beards?
On men's faces dealt at random, a short beard was tapped most (11.6%), a moustache 10.2%, a clean-shaven face 10.1%, stubble 10.0% and a full beard least (5.9%). The full beard divides people: most runs passed over those faces, while runs that tapped one were much more likely to tap another. The test does not record the sex of the person tapping, so this is everyone who chose men's faces.
Which heritage or ethnicity was tapped most?
Each AI face carries a heritage label given by a vision model. Women's faces: White 12.1%, East Asian 12.0%, Mixed 11.3%, Southeast Asian 10.7%, Middle Eastern or North African 10.0%, Latino 9.6%, South Asian 7.9%, Black 5.3%. Men's faces: White 12.3%, Mixed 12.1%, Latino 11.3%, Middle Eastern or North African 10.2%, East Asian 9.5%, Southeast Asian 8.0%, South Asian 7.1%, Black 5.2%. These rates describe who played that week (19,646 of 48,356 runs were in United States) and they differ by country; they are also the looks on which runs disagree most.
What age is tapped most?
The youngest-looking adult faces. Women's faces that look under 25 were tapped 18.4% of the time, 25 to 29 12.2%, 30 to 39 7.4%, 40 to 49 4.0% and 50 or over 2.0%. Men's faces: 14.3%, 12.0%, 8.0%, 4.9% and 2.1%. Every face in the deck is an AI-generated adult, and the age is how old the face looks. The players' own ages are not recorded.
Are glasses, freckles and dimples attractive?
Small differences. Women's faces with glasses were tapped 8.9% against 10.6% without; men's 9.7% against 10.2%. Freckles: 11.9% against 10.0% on women's faces and 11.8% against 9.8% on men's. Dimples: 10.7% against 10.3% on women's faces and 11.4% against 10.0% on men's.
How picky are people about faces?
Very. In more than half of randomly dealt grids of 12 faces, nothing was tapped. The picky quarter of runs tapped 1.6 faces a grid or fewer over a run, and 2.1% of randomly dealt women's faces and 1.9% of men's; the easy-going quarter tapped 8.5 or more a grid, and 30.8% and 31.4% of randomly dealt faces.
Do people agree on who is attractive?
Partly. When one run tapped a randomly dealt face, a second run shown the same face tapped it 16.4% of the time (women's faces) and 15.7% (men's), against 9.9% and 10.3% when the first run passed over it. Of the faces at least one of two runs tapped, both tapped 9.0% and 8.5%.
Does taste in faces differ by country?
In this data, yes. Among the 17 countries with 500 or more runs, the share of randomly dealt men's faces tapped ran from 5.0% in Finland to 14.9% in Brazil, and countries differed in which looks they tapped more than the rest. The figures describe who in each country played that week, not the country.
Are these statistics about real people?
The taps are real: 4,502,629 taps in 48,356 runs. The faces are not: every face in the deck is AI-generated. A run is one pass through the test, not a person, and nothing links a visitor's runs. The sample is people who chose to play a free online test, so the figures do not describe the population of any country.
Try it on yourself
The test these figures come from, and the tools that measure your own face.
Find Your Type
FreeTap the faces you like and see the looks you go for, with how far you are from the crowd.
Attractiveness Test
FreeYour own face measured: symmetry, proportions and a score with what moves it.
Face Shape Statistics
How common each face shape was in 2,048,842 analyses, with the method and a CSV.